 EN
 Deutsch
 Español
 Français
 Italiano
 Português
 Nederlands
 Polski
 Bahasa Indonesia
 Русский
 Українська
 العربية
 עברית
 हिन्दी
 日本語
 한국어
2026-01-12
Why Executives Ignore Power BI Dashboards
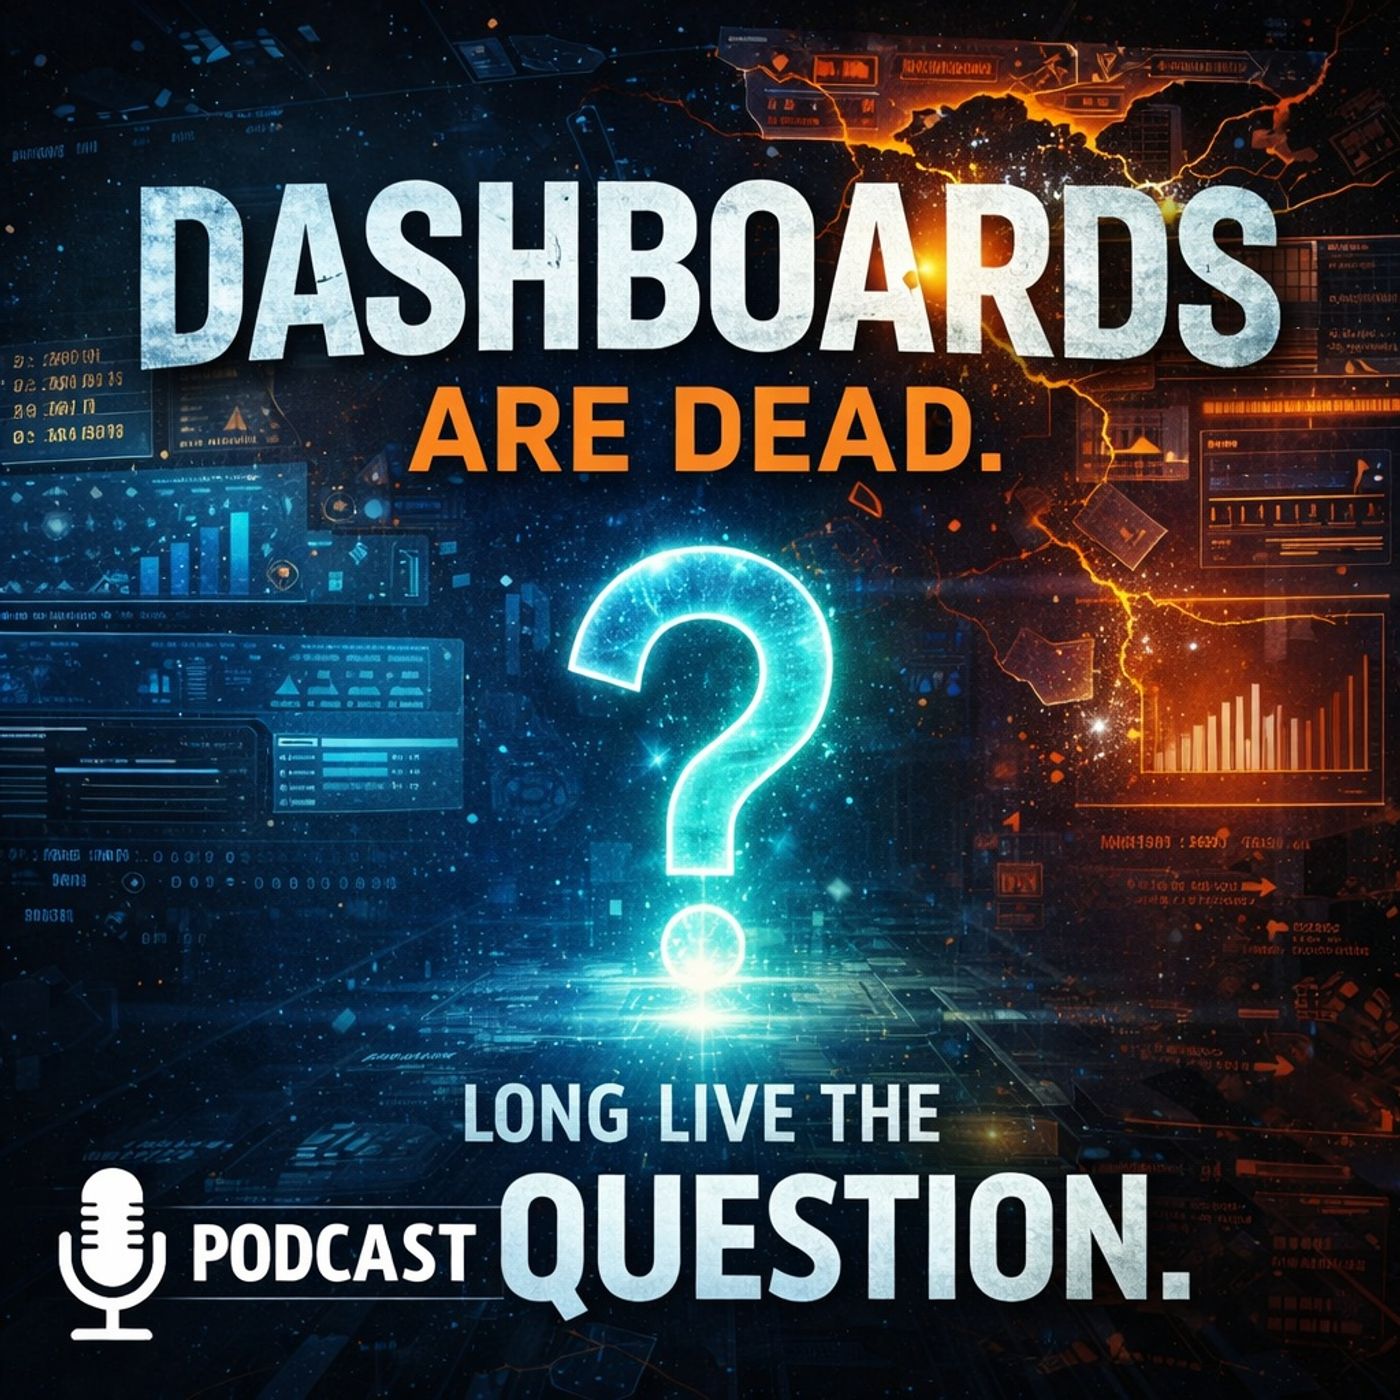
Are dashboards still relevant in today’s data-driven world? Absolutely! While some might say dashboards are dead, they’re actually evolving to meet new demands. In fact, 77% of business leaders still rely on dashboards for decision-making. However, as you navigate this landscape, it’s essential to rethink how we visualize data beyond static dashboards. The future lies in integrating storytelling and AI, transforming how you interact with data and make informed decisions.
| Feature/Aspect | Traditional Dashboards | Modern Dashboards (AI-Augmented) |
|---|---|---|
| Interactivity | Static, limited interactivity | Highly interactive with drill-downs and filters |
| Data Updates | Periodic updates | Real-time updates |
| AI Integration | None | AI for natural language querying and predictive analytics |
| User Accessibility | Primarily for data experts | Intuitive for all users, including non-experts |
| Focus | Backward-looking reports | Prescriptive and live analytics |
| Collaboration | Limited sharing capabilities | Enhanced collaboration through embedded insights |
| Customization | Fixed layouts | Highly customizable interfaces |
Key Takeaways
- Dashboards are evolving, not dying. They now integrate storytelling and AI for better decision-making.
- Static dashboards can overwhelm users. Focus on fewer, more relevant metrics to avoid information overload.
- Data narratives provide context. They help explain trends and connect insights to business goals.
- AI enhances data visualization. It automates analysis and provides real-time insights, making data easier to understand.
- Use storytelling techniques to engage your audience. Clear visuals and logical flow make data memorable.
- Adopt a hybrid approach. Combine dashboards, storytelling, and AI for a comprehensive data experience.
- Stay updated on trends. Watch for innovations like modular architectures and multi-modal dashboards to enhance your strategies.
- Embrace a data-driven mindset. Shift from guessing to making informed decisions based on insights.
Limitations of Dashboards

Static Views and Information Overload
Traditional dashboards often present a static view of data, which can lead to significant information overload. When you look at a dashboard filled with numerous key performance indicators (KPIs), it’s easy to feel overwhelmed. You might find yourself asking, "What does all this mean?" This confusion arises because dashboards frequently track too many metrics without linking them to specific decisions.
Research shows that this overload can slow down decision-making. In fact, 77% of executives admit they only sometimes or rarely challenge the data presented to them. This indicates a troubling trend: despite having access to vast amounts of data, leaders often struggle to make timely decisions. The sheer volume of information can lead to decision fatigue, where you feel paralyzed by the options in front of you.
Moreover, dashboards can obscure critical insights. For example, small incidents that negatively impact performance often go unnoticed. These incidents can accumulate over time, leading to significant issues that could have been addressed earlier. This phenomenon, sometimes referred to as "death by dashboard," highlights the dangers of relying solely on static displays of data.
Lack of Context and Narrative
Another major limitation of dashboards is their lack of context and narrative. Dashboards typically report what happened but fail to explain why it happened. This absence of narrative can leave you feeling confused and disengaged. You might find yourself staring at vanity metrics without understanding their significance.
For instance, if a dashboard shows a spike in sales, you may wonder, "What caused this increase?" Without context, you can't connect metrics to your business goals, which diminishes your ability to make informed decisions. Many organizations develop dashboards in isolation, leading to metrics that don’t align with actual business objectives. This disconnection can result in dashboards that look impressive but fail to provide actionable insights.
Additionally, evaluating metrics in isolation can lead to misunderstandings about their impact. If you only focus on one metric, you might miss the bigger picture. For example, a dashboard might show high average uptime for a server cluster, but if one server experiences significant downtime, it can remain unnoticed. This lack of narrative context can lead to misinformed decisions that negatively affect your organization.
Decision Latency Issues
Finally, dashboards can create decision latency issues, especially in fast-paced industries. When every dashboard view feels like a decision obligation, it can lead to a fragmented cognitive state. You might find yourself overwhelmed by the need to analyze every piece of data, which can slow down your ability to act.
Studies indicate that 67% of executives worry that over-reliance on static dashboards causes teams to miss emerging opportunities and risks. This concern highlights the importance of decision velocity—how quickly you can move from inquiry to action. When dashboards fail to provide real-time insights, they can hinder your ability to respond promptly to critical situations.
Data Narratives and Storytelling
What Are Data Narratives?
Data narratives are more than just numbers on a screen; they are stories that help you make sense of complex information. Think of them as a way to weave together data points into a coherent tale that highlights trends, insights, and implications. In essence, data narratives transform raw data into meaningful stories that resonate with your audience. They play a crucial role in sensemaking, which is the process of interpreting and deriving meaning from information. When you engage with data narratives, you connect the dots between past and present experiences, allowing for a deeper understanding of the data's significance.
Benefits Over Traditional Dashboards
Why should you consider data storytelling over traditional dashboards? Here are some compelling reasons:
- Enhanced Communication: Data storytelling improves how you convey information. It fosters better understanding and engagement among stakeholders compared to static dashboards.
- Increased Retention: Research shows that stories are 22 times more memorable than standalone facts. By presenting data in narrative form, you make it easier for your audience to remember key insights.
- Contextual Clarity: Data narratives provide context that dashboards often lack. They explain why certain trends occur, helping you connect insights to your goals.
- Actionable Insights: A well-crafted narrative can persuade decision-makers to act. It nurtures their understanding of what’s at stake, driving informed decisions.
Techniques for Effective Storytelling
To create impactful data narratives, consider these techniques:
- Visual Cues: Use color strategically to highlight patterns and evoke emotions. This helps draw attention to critical data points.
- Clear Visualization: Combine visuals with your narrative to enhance understanding. Well-crafted visualizations can simplify complex data concepts.
- Sequencing and Flow: Arrange your visuals logically to create a coherent narrative. This guides your audience through the story, making it easier to follow.
- Storyboarding: Plan your narrative structure before diving into the visuals. This ensures that your story flows smoothly and keeps your audience engaged.
By employing these techniques, you can create dynamic data stories that captivate your audience and drive meaningful discussions.
AI and the Operating System for Decisions
AI-Powered Insights
Artificial intelligence is revolutionizing how you interact with data. It transforms traditional dashboards into dynamic tools that provide real-time insights. With AI, you can automate data transformation tasks, which reduces the manual workload. For instance, AI can map and normalize data, detect anomalies, and suggest necessary transformations. This means you spend less time on tedious tasks and more time making actionable insights.
Here are some key ways AI generates insights from your business data:
- AI processes large volumes of data quickly, uncovering patterns that traditional methods might miss.
- Self-service analytics allow you to query datasets using natural language, making it easier to trigger automated workflows.
- Prescriptive analytics combines predictions with optimization models, recommending actions that maximize objectives like revenue or retention.
- Augmented analytics proactively surfaces insights, providing alerts for unexpected trends or anomalies.
Predictive Analytics Integration
Integrating predictive analytics into your data visualization tools enhances their value significantly. This integration helps you forecast future trends, allowing you to anticipate market changes and adapt your strategies accordingly. Here’s how predictive analytics can benefit you:
- It provides actionable insights that help you make informed decisions.
- Predictive capabilities allow you to understand consumer behavior better, improving your strategic decision-making.
- The integration simplifies complex data, revealing hidden patterns that enhance communication with stakeholders.
Industries like healthcare, insurance, and marketing have seen tremendous impacts from predictive analytics. For example, healthcare uses data to improve patient care and forecast health trends, while marketing analyzes data to understand customer behavior and predict trends.
Enhancing User Interaction
AI-driven data visualization interfaces have evolved significantly. They now support real-time responsiveness and allow you to interact more intuitively with complex data. Here are some improvements you can expect:
- Multimodal interaction methods, including natural language and gestures, create engaging user experiences.
- Visualization functions as an active component in the analysis process, guiding you through query reformulation and feedback.
- AI customizes dashboards based on user behavior, ensuring relevant metrics are highlighted for each role.
With these advancements, you can navigate through uncertainty more effectively, making your decision-making process smoother and more efficient.
Dashboards Aren't Dead: The Future
Hybrid Approaches for Better Decision-Making
Dashboards aren't dead; they're evolving into hybrid solutions that combine the best of dashboards, storytelling, and AI. This approach leverages the strengths of each component to enhance your decision-making process. You get immediate visual comprehension from dashboards, while storytelling adds context and emotional connection to the data. AI automates data analysis, detects patterns, and suggests visualizations, but it still relies on human judgment to interpret context and craft narratives.
By integrating these elements, you can reduce cognitive bias and improve decision-making outcomes. For example, a healthcare organization used an AI-powered analytics platform to monitor patient outcomes. The AI generated visualizations quickly, but it was the human experts who interpreted these findings, ensuring the insights were relevant and actionable.
Tools Supporting Evolution
As dashboards evolve, several tools are leading the charge in creating more interactive and narrative-driven platforms. Here’s a quick look at some popular options:
| Tool Name | Key Features | Pricing | Best Use Case |
|---|---|---|---|
| Tableau | Intuitive visuals, advanced analytics | $70/user/month | Data Analysts |
| Power BI | Microsoft integration, robust reporting | $9.99/user/month | Small to large enterprises |
| Qlik Sense | Associative engine, AI-powered insights | Customized quotes | Dynamic data environments |
| Looker | Google Cloud Platform integration, custom apps | $5000+/month (annual pricing) | Enterprises needing custom solutions |
| Domo | Real-time analytics, extensive data connectors | Customized quotes | Marketing and executive teams |
These tools support the evolution of dashboards by offering features like real-time data connections, natural language processing, and automated insights. They allow you to customize dashboards to fit your specific needs, enhancing user engagement and relevance.
Future Trends to Watch
Looking ahead, several trends are shaping the future of data visualization beyond dashboards. Here are a few to keep an eye on:
| Trend Description | Key Features |
|---|---|
| Data Storytelling | Combines data visualization with narrative techniques to create engaging and memorable presentations. |
| Modular Visualization Architectures | Enables organizations to upgrade and scale visualization layers independently through decoupled architectures. |
| Multi-modal Dashboards | Integrates structured and unstructured data types for comprehensive analytical experiences. |
These trends reflect a shift towards more dynamic and interactive data experiences. As organizations embrace these innovations, they will enhance visibility and foster confident decision-making.
Dashboards have come a long way, evolving from simple charts to powerful tools that blend storytelling and AI. You still rely on dashboards, but now they work best when they add context and clear narratives to your data. To get the most from your dashboards, you should embrace new ways that combine clarity, interactivity, and insight.
Remember, the future of data visualization depends on your willingness to shift from static views to dynamic, AI-powered experiences.
Here are some mindset shifts to keep in mind:
- Move from guessing to data-driven decisions.
- Shift from reacting to predicting with data.
- Break down silos and share data across teams.
By adopting these changes, you’ll unlock the true power of dashboards and data for smarter, faster decisions.
FAQ
What is the main purpose of data visualization?
Data visualization helps you understand complex data by presenting it visually. It turns raw numbers into clear graphics, making it easier to spot trends and insights.
How can storytelling improve data visualization?
Storytelling adds context to your data. It helps you connect the dots, making the information more relatable and memorable for your audience.
Why should I consider using AI in data visualization?
AI enhances data visualization by providing real-time insights and automating data analysis. It helps you uncover patterns and make informed decisions faster.
Are dashboards still useful in modern data strategies?
Yes! Dashboards are evolving. They now integrate storytelling and AI to provide actionable insights, making them valuable tools for decision-making.
What are some popular tools for data visualization?
Some popular tools include Tableau, Power BI, and Qlik Sense. Each offers unique features to help you visualize and analyze your data effectively.
How can I create effective data narratives?
To create effective data narratives, use clear visuals, logical sequencing, and engaging storytelling techniques. This approach helps your audience grasp the insights easily.
What trends should I watch in data visualization?
Keep an eye on trends like data storytelling, modular visualization architectures, and multi-modal dashboards. These innovations will shape the future of data visualization.
How can I improve my decision-making with data?
You can improve decision-making by embracing data-driven insights, leveraging AI tools, and integrating storytelling into your visualizations. This approach fosters clarity and confidence.
🎧 Listen to this episode
Want a practical explanation of Why Executives Ignore Power BI Dashboards? This episode breaks down the topic in clear language and shows why it matters for Microsoft 365, Azure, Power Platform, security, AI, and modern work.
Listen to this episode if you want to:
- Understand the key concepts behind Why Executives Ignore Power BI Dashboards
- See how it fits into the wider Microsoft technology ecosystem
- Learn where it can create practical value for your organization
You may also enjoy these related M365 FM episodes:
- Replace Reactive Dashboards with Proactive Notifications
- Fix Microsoft 365 Compliance Drift Beyond Green Dashboards
- Make Power BI Dashboards Drive Better Decisions
- Customize Microsoft Viva Connections Dashboards
- Teams vs SharePoint for Power BI Dashboards
Discover more practical Microsoft conversations on M365 FM.
Apple Podcasts · Spotify · YouTube · YouTube Music
Host: Mirko Peters